











Power BI Dataflows Best Practices: Scale Your Business Analytics

Power BI Dataflows best practices: Scale your business analytics

Table of Contents

Making informed, quick decisions is a cornerstone of success for any organization. To achieve this, having access to accurate, real-time data is crucial. This is where Power BI comes into play. In this blog, we’ll explore the world of Power BI dataflows, offering valuable insights into what Power BI is, how it works, and the best practices for implementing it. Additionally, we’ll delve into the myriad benefits that Power BI brings to your business, transforming your data into actionable insights. 

What is Power BI?

Power BI is a powerful business intelligence tool developed by Microsoft that allows businesses to transform raw data into meaningful insights. It offers a user-friendly interface and a robust set of tools for data analysis, visualization, and sharing. Now with added AI capabilities through Copilot integration, Power BI helps businesses connect to a variety of data sources, create interactive reports and dashboards, and collaborate with teams to make data-driven decisions.

How does Power BI work?

Power BI works by connecting to various data sources, which can include databases, spreadsheets, cloud services, and more. Once connected, users can shape, model, and transform the data using Power Query, a data preparation tool. The data can then be visualized using Power BI’s rich set of visualization options. Real-time updates, data sharing, and integration with other Microsoft tools make Power BI a comprehensive solution for data analysis. 

business man in an online meeting Microsoft Teams

Microsoft 365 productivity & collaboration solutions

Empower your employees to do their best work regardless of their location or device 

Power BI best practices 

To harness the full potential of Power BI dataflows, it’s essential to follow best practices. We’ll explore the dos and don’ts, from data modeling and visualization design to dataflow optimization and security. These best practices will help you build efficient and reliable data solutions that drive your success. 

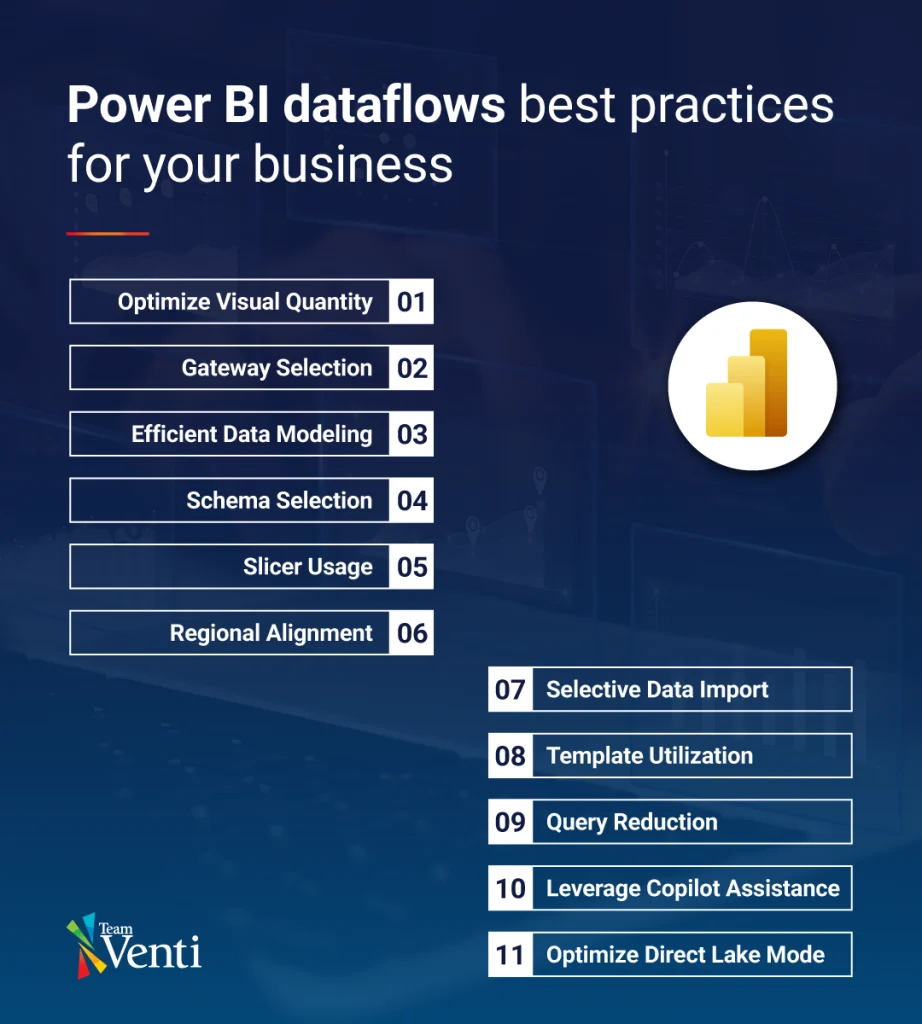
  • Optimize Visual Quantity: Restrict the number of visuals on your reports and dashboards. It’s recommended to limit widget visuals to eight per report page and grids to one per page, with a maximum of 10 tiles per dashboard. 
  • Gateway Selection: Choose the on-premises data gateway standard mode over personal mode. Standard mode is more efficient when dealing with large databases compared to personal mode. 
  • Efficient Data Modeling: Minimize complex measures and aggregations in data models by creating calculated measures rather than calculated columns. Try to push calculated columns and measures closer to the data source for improved performance. 
  • Schema Selection: When possible, opt for a Star schema instead of a Snowflake schema, as it simplifies query structure, reduces joins, and minimizes data redundancy. 
  • Slicer Usage: Use slicers judiciously, as they can impact performance. Each slicer generates two queries, affecting data retrieval. Consider the Filter pane to evaluate and remove unnecessary slicers. 
  • Regional Alignment: Ensure that your reports and data sources are in the same region to reduce network latency, leading to faster data transfer and query execution. 
  • Selective Data Import: Import only necessary fields and tables instead of entire data sets to keep the data model narrow and efficient. 
  • Template Utilization: Use templates (.PBIT files) to expedite and standardize report development. Templates help in maintaining branding, connecting to data sources, and offering common DAX measures. 
  • Query Reduction: Reduce the number of queries by using query reduction settings for slicers and filters, optimizing performance. Be cautious about bi-directional relationships against high-cardinality columns, as they can negatively impact report performance. 
  • Leverage Copilot Assistance: Use Copilot to automate different tasks and enhance productivity, from analysis for business users, to DAX (Data Analysis Expression) generation.  
  • Optimize Direct Lake Mode: With Power BI’s Microsoft Fabric integration, you can now manage complex data, real-time querying and leverage AI enhancements, giving you faster insights all in one platform. 
Power BI Best Practices

Leverage the benefits of Power BI for your organization 

The benefits of Power BI extend far beyond data visualization. By using Power BI effectively, your organization can unlock new opportunities, streamline operations, and gain a competitive edge.  

If you’re looking to optimize your data analysis and visualization capabilities, Team Venti, a Microsoft Gold Partner is here to assist. With deep understanding of Power BI dataflows, expertise in Power Platform, Power Apps, and Power Automate, we can help integrate these Microsoft solutions seamlessly into your business processes, ensuring you make the most out of these powerful tools to drive success. 

Picture of Lucy Camero

Lucy Camero

Team Venti Brand Manager

Sign up to learn more

Get news, updates, and insights about Microsoft solutions, technologies, and best practices.

Share This Story, Choose Your Platform!

Related posts